Summarize this article with:
Sommaire
Introduction
Transport costs are constantly on the rise. Fuel, payroll, vehicle maintenance, tolls... Each item weighs more heavily on operating accounts, and margins are squeezed. At the same time, regulatory and customer pressure around carbon footprints is intensifying: CSRD, low-emission zones, scope 3 commitments from major clients.
Faced with these challenges, route management is one of the first levers to be activated, even before considering fleet renewal or electrification. Tools, software and other applications for route optimization are plentiful, and act as decision-making aids. But what gains can you really expect from them? How can they be measured? And how do you go from intention to concrete action?
This article gives you the keys to assessing the real potential of your delivery routes in your organization, on two complementary dimensions: economic performance and ecological impact.
Why optimize your delivery routes?
Operating costs under constant pressure
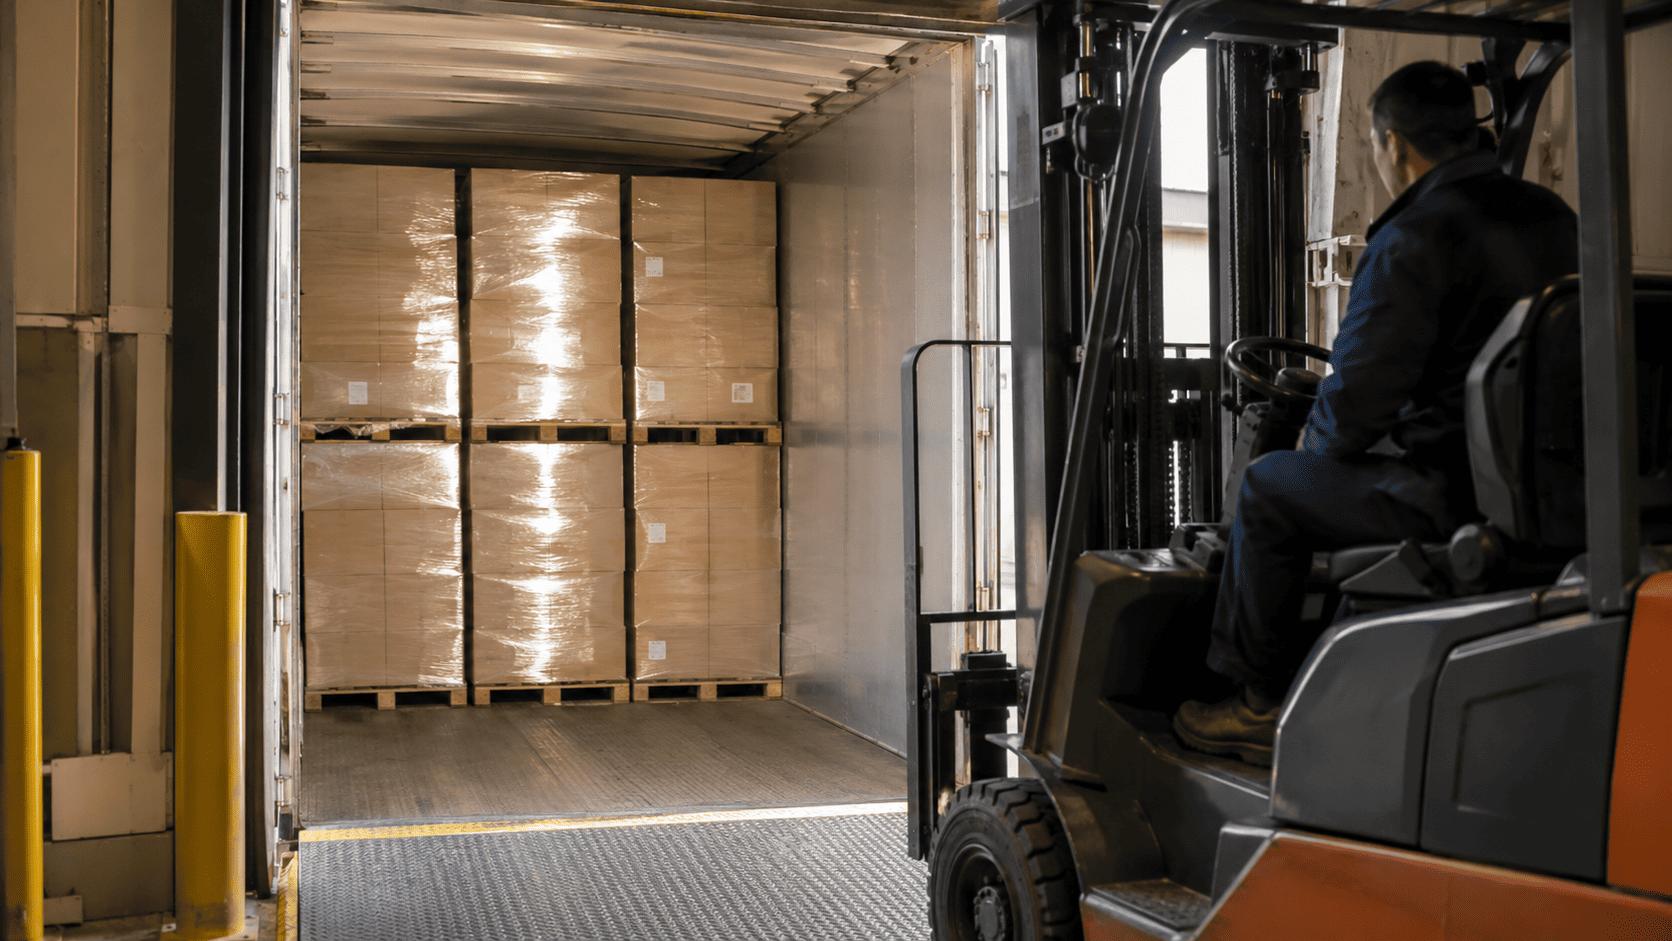
Road haulage is subject to structural cost inflation. According to the Comité National Routier (CNR), fuel accounts for between 25% and 32% of the total cost of a vehicle, depending on the type of round. Driving personnel costs account for almost 30%. These two items alone absorb more than half of operating costs.
Yet a large proportion of the kilometers driven each day are the result of sub-optimized routes: empty returns, unnecessary detours, inefficient sequencing of stops, poor load distribution between vehicles. These are kilometers paid for twice: in direct costs (fuel, wear and tear, driving time) and in lost earnings (unused delivery capacity). All these costs encourage even more rigorous route planning to keep transport costs under control.
Regulatory constraints make planning more complex
Beyond the financial aspect, operations managers are faced with increasingly stringent legal requirements: driving time regulations (European directive on drivers' working hours), progressive deployment of low-emission zones (ZFE) in major conurbations, and traceability obligations for certain types of goods such as fresh produce.
These constraints reduce the room for maneuver in planning, and make route scheduling even more complex to manage manually. Each route must now take into account not only traditional operational constraints (delivery slots, vehicle capacity, driver availability), but also legal and environmental requirements that vary according to geographical area and type of activity.
There are also regulations linked to the type of vehicle: the regulations and therefore the route planning of a compartmentalized tanker truck will be different from that of a refrigerated truck.
Environmental impact directly correlated with kilometers traveled
Road transport is France's biggest emitter of greenhouse gases, accounting for 28% of national emissions according to ADEME. Road freight accounts for a significant proportion of this, with emissions directly linked to fuel consumption and therefore to kilometers traveled.
The relationship is simple: every kilometer saved is a kilometer not emitted. A light commercial vehicle emits an average of 170 gCO2/km (source: ADEME, Base Carbone), and a heavy goods vehicle up to 900 gCO2/km, depending on its load. Reducing tour mileage is therefore the most immediate, most measurable and least costly lever for decarbonization.
This is all the more strategic as scope 3 reporting obligations become more widespread under the CSRD directive. Emissions linked to freight transport fall within this scope. Shippers will need to be able to quantify and reduce these emissions, including those generated by service providers.
Figures on the concrete benefits of optimizing transport routes
How to calculate your own potential gains
Rather than announcing universal profit percentages (which vary considerably depending on the sector, tour density and organizational maturity of each company), it's more rigorous to start from a calculation mechanism applicable to your own situation.
Let's take a concrete, and deliberately simple, example:
- 10 vehicles in operation
- 150 km travelled on average per vehicle per day
- 220 working days per year
330,000 km/year for the entire fleet. Let's take as an example a 15% reduction in kilometers traveled thanks to improved route planning. This represents savings of 49,500 km per year, or :
- Fuel savings: around 7,400 liters saved (based on 15L/100km) × diesel price ≈ 11,000 to 13,000 €/year
- CO2 reduction: around 19.5 tonnes of CO2 avoided (base: 400 gCO2/km part-load, source ADEME Base Carbone)
-
Driving time recovered: at an average speed of 40 km/h, this represents around 1,200 hours of driving time recovered, which can be redeployed on other routes or used to reduce overtime.
This calculation applies to a fleet of light commercial vehicles in an urban or suburban environment. For a carrier operating heavy goods vehicles over long distances, unit emissions are higher (up to 900 gCO2/km unladen). This mechanically amplifies the environmental impact of each kilometer saved, and further strengthens the economic argument, as diesel weighs more heavily in the cost price.
This calculation is just an example to help you project the benefits you'll see, which will depend on your context.
What sector data say
Every year, the CNR publishes its road transport cost indices. In 2024, fuel, tires and maintenance together accounted for over 40% of a vehicle's variable costs. These are precisely the items most sensitive to mileage, and therefore the first to benefit from route optimization.
In terms of CO2, ADEME estimates that road freight transport emits an average of 107.5 million tonnes of CO2 equivalent per year in France. At company level, every point reduction in mileage translates directly into tons avoided. This is a powerful argument for CSR managers in charge of CSRD reporting.
Above all, reduced costs and ecological impact also mean competitive advantages.
How do you measure the impact of route optimization?
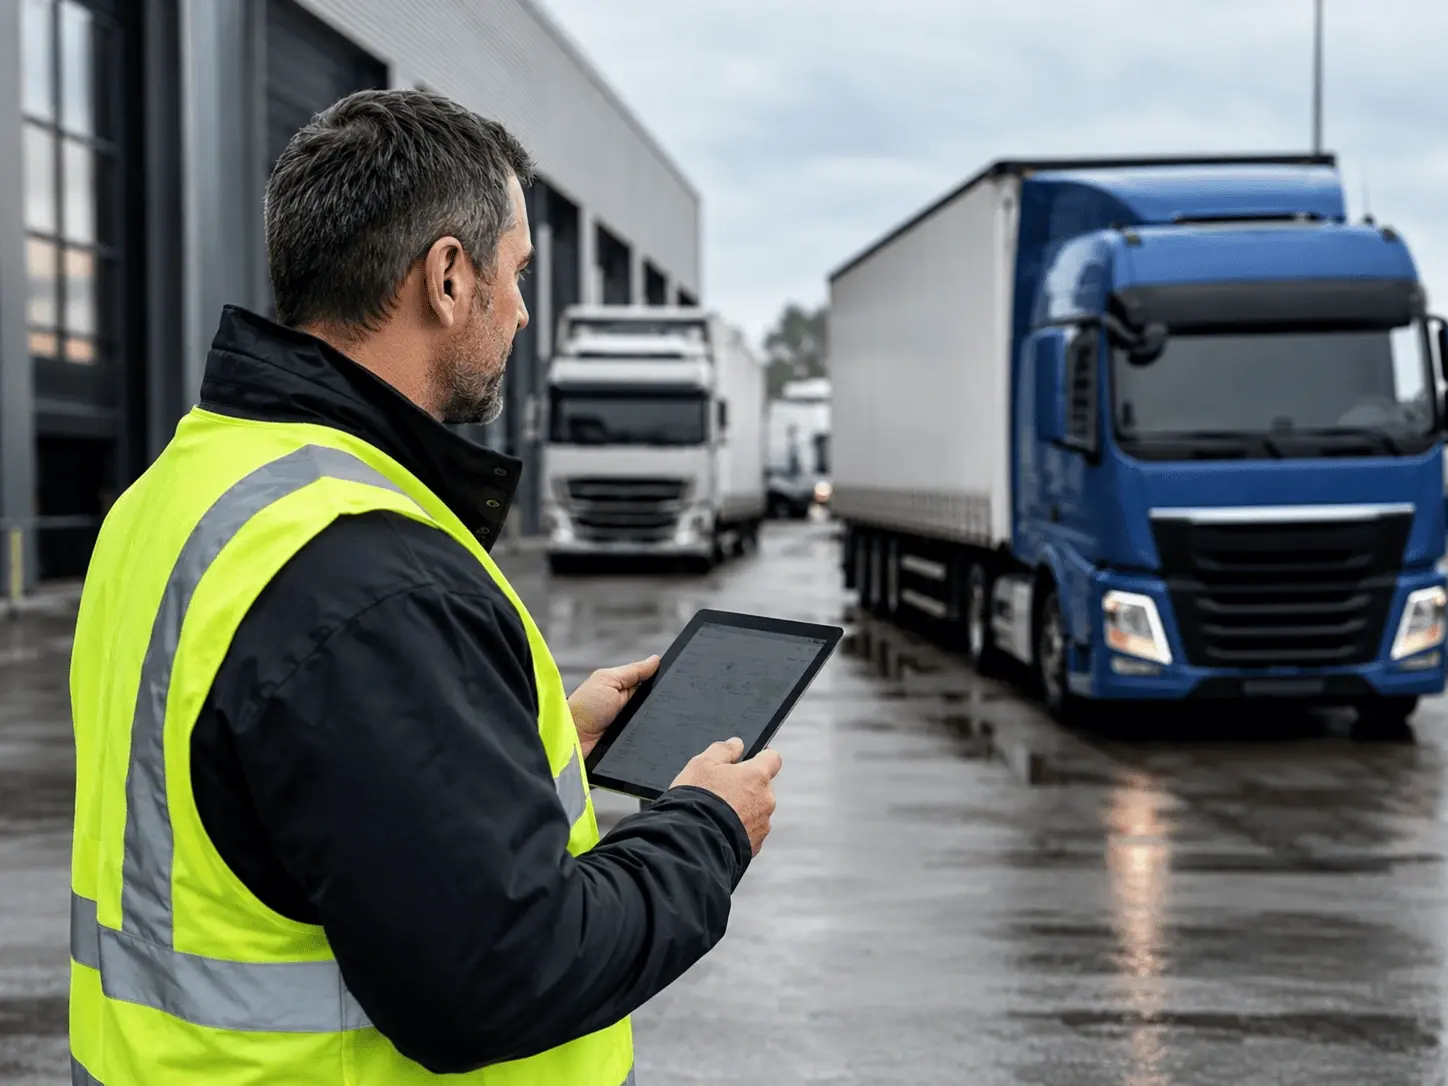
Start by collecting the right data
Before you can measure benefits, you need a reliable baseline. This presupposes that you have collected, over a representative period (ideally 3 to 6 months), the raw data from your current routes: kilometers traveled per vehicle, number of deliveries made, fuel consumption, slot compliance rate, number of stops not honored.
The implementation of this data collection stage is often underestimated. However, it determines the quality of the evaluation and the credibility of the gains you can present internally, whether to justify a software investment or to feed into a CSR report.
KPIs to track
Once the baseline has been established, here are the essential performance indicators to track, divided into two categories.
Economic indicators
- Cost per delivery made: to smooth out variations in volume and compare over time
- Kilometers travelled per round: the most direct barometer of planning efficiency, showing concrete mileage reductions.
- Vehicle load factor: reveals load imbalances between vehicles
- Number of rounds per driver per day: an indicator of operational productivity
- Cost per kilometer: cross-referenced with CNR indices to benchmark performance.
We could also add to this category time savings measured on a route-by-route basis.
Environmental indicators
- CO2 emissions per tour (in kg or tons): can be calculated using ADEME's Base Carbone.
- Total fuel consumption and per vehicle: direct proxy for emissions
- Empty kilometers: key indicator of the efficiency of round-trip planning
- Fleet utilization rate: fewer vehicles used = lower overall emissions
Calculate return on investment
The return on investment of optimization software can generally be calculated as follows:
ROI = (Annual savings generated - Annual software cost) / Annual software cost × 100
In most cases, savings on fuel and driver hours alone are sufficient to cover the cost of a SaaS optimization solution in the first year of use.
Optimization challenges and how to overcome them
Above all, organizational challenges
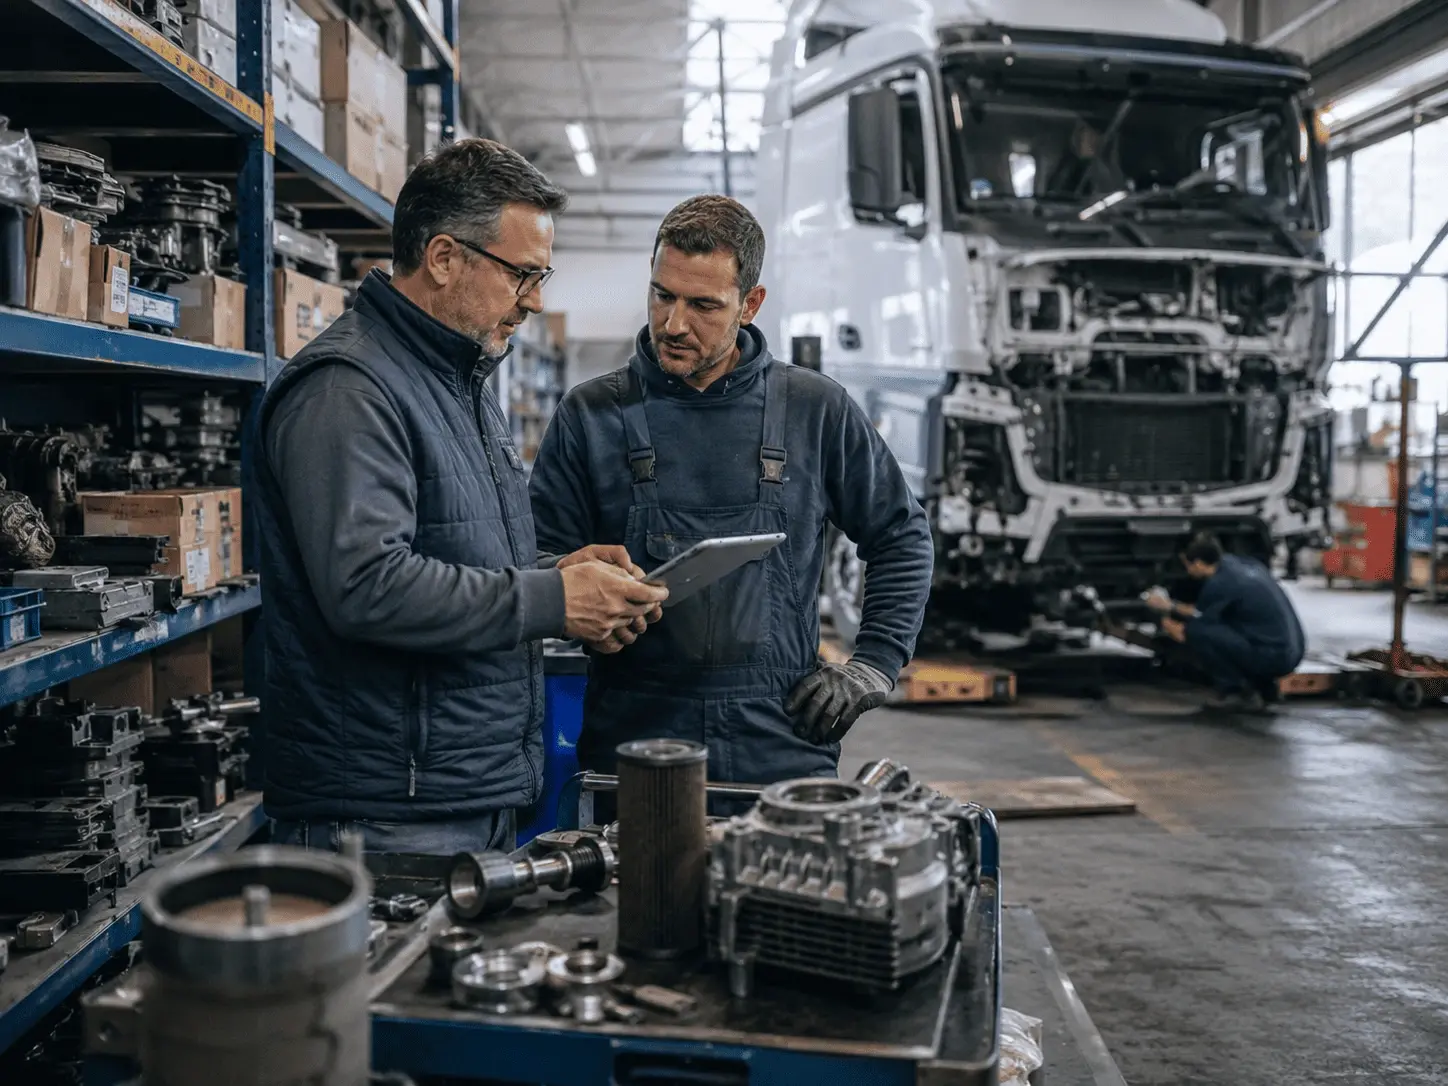
Tour execution is not just a question of algorithms. In practice, companies that struggle to reap the full benefits rarely come up against purely technological obstacles: they come up against human and organizational challenges.
The first of these is the quality of the input data . Optimization software only produces good results with reliable information: correctly geocoded addresses, real (not fictitious) time slots, order weights and volumes, up-to-date vehicle constraints, real driver availability. Approximate data generates technically-optimal routes... but ones that cannot be implemented in the field.
The second challenge is adoption by field teams. A route optimized by an algorithm can upset the habits of drivers, who have often developed their own routines over the years. Driver buy-in is a key success factor that is all too often overlooked when deploying an optimization solution, and one that needs to be incorporated into the company's digital transformation from the outset.
Finally, the growing complexity of constraints (EPZs, strict time slots, transport of fresh produce, legal requirements on driving times) calls for a fine-tuned parametric approach. The greater the number of constraints, the wider the gap between a well-configured solution and a generic one.
Tools to meet these challenges
Good route management relies on software capable of simultaneously handling dozens of constraints: time windows, service time at each stop, loading capacity, driver availability, real-time traffic, driving time rules. These software solutions respond directly to organizational challenges by structuring data collection and facilitating adoption in the field.
Key features to look for in a solution include
- Automatic multi-constraint scheduling: integrates time slots, vehicle capacity, driver skills and legal requirements
- Dynamic optimization: recalculates routes in the event of unforeseen events (driver absence, delays, urgent new orders)
- Real-time tracking: visibility of route progress and alerts in the event of deviations from schedule
- Dematerialized proof of delivery: reduces disputes and improves traceability of operations
- KPI dashboard: for performance management and CSR reporting
- Integration with existing information systems (ERP, TMS, WMS) via API to avoid re-entries and ensure data reliability
Customer satisfaction: an often underestimated benefit
The benefits of route management are measured in more than just euros and CO2. There's a third benefit, often less visible in ROI calculations, but just as strategic: improved customer satisfaction and hence a better customer experience.
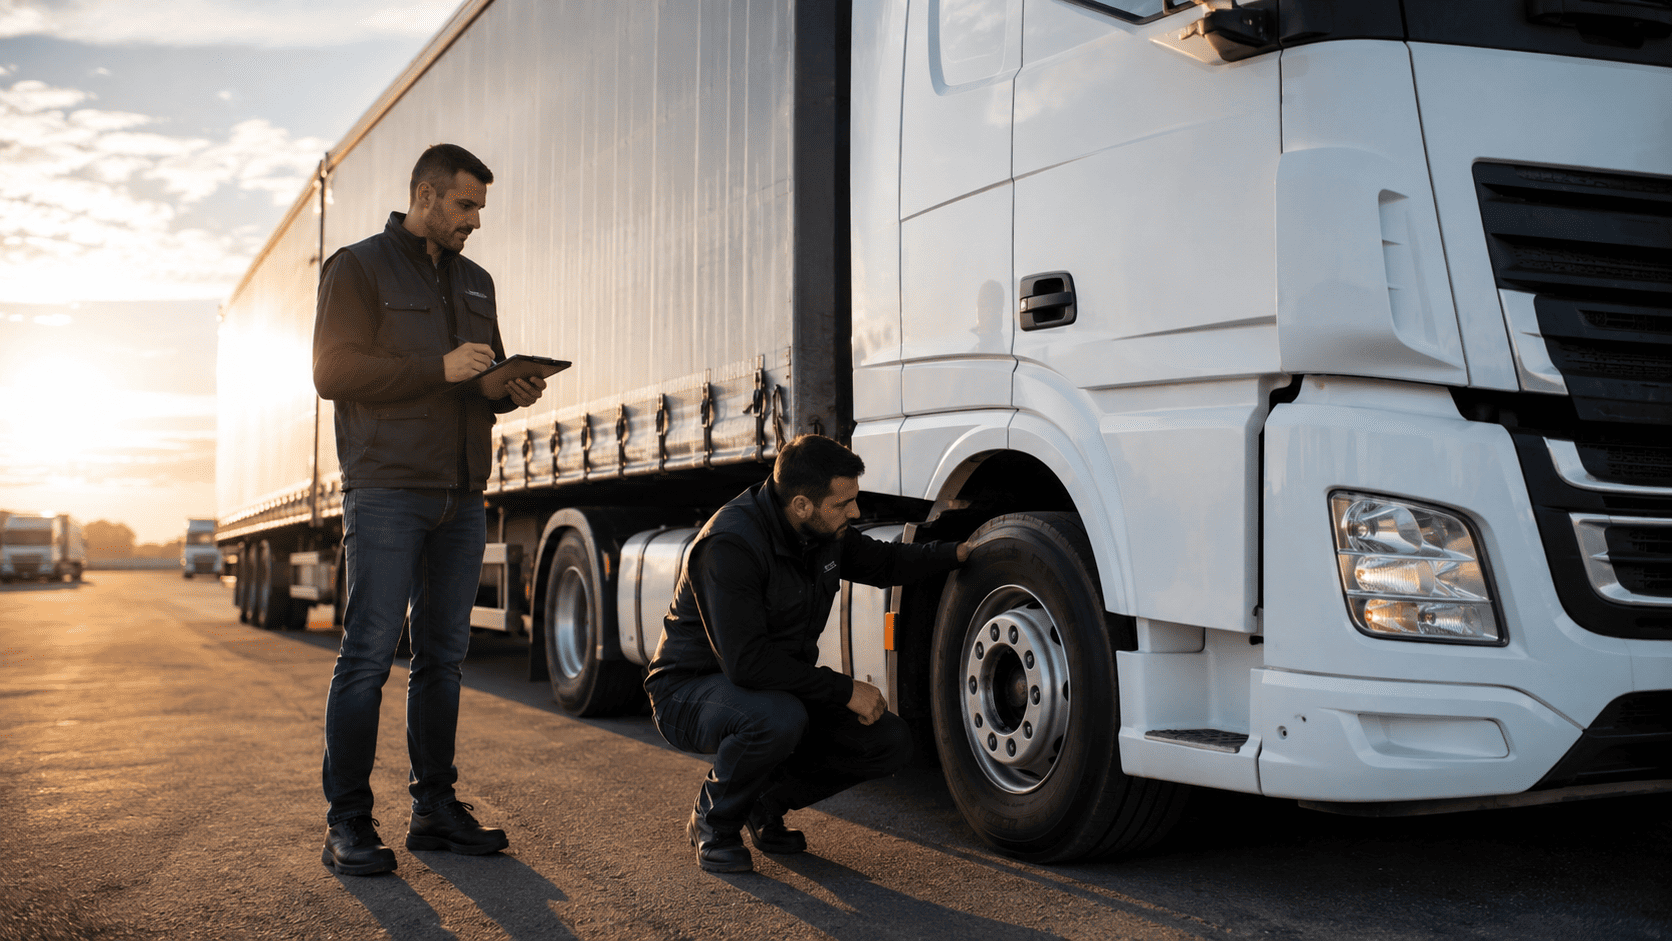
On-time delivery as a competitive advantage
A business customer who consistently receives deliveries within the agreed timeframe is a loyal customer. Respecting delivery deadlines, made possible by precise route planning, reduces disputes, cuts the number of incoming calls to customer service and measurably improves customer satisfaction. This is a direct competitive advantage, particularly in sectors where deadlines are contractual.
The real-time tracking offered by modern software also enables delays to be proactively prevented: the customer is informed even before the deviation becomes a problem. Transparency of delivery progress is now a key expectation of both BtoB and BtoC customers. It's a form of customer service that manual planning simply can't offer on a large scale.
Fewer errors, fewer returns, greater loyalty
A well-optimized tour also means a better-prepared tour: the right parcels at the right time in the right vehicle. Reducing delivery errors (wrong address, missed slot, forgotten parcel) has a direct impact on reverse logistics costs and customer relations. Each error avoided means one less return cost and a better customer experience.
In sectors where last-mile delivery is a differentiating factor (food, pharmaceuticals, time-sensitive B2B), this dimension of optimization can represent a real competitive advantage. Service quality then becomes a sales argument in its own right, measurable via the customer satisfaction rate and the on-time delivery rate.
Conclusion
Route optimization is one of the few levers that can simultaneously reduce operating costs, cut CO2 emissions and improve customer service. Its impact is measurable, quick to observe and directly assessable, whether in a management report or in a CSR report.
The question is therefore to understand where to start, which indicators to monitor and what level of technological maturity is appropriate for your organization. And often, the first step is simpler than you might think: audit your existing data and simulate the potential gains on your current routes.
.webp)
.webp)
.webp)
.webp)
.webp)